SPLap — machine data at race pace

A father-daughter project · for people who love F1 and machine data

We put a Grand Prix inside Splunk.

Real race telemetry — 20 cars at 3.7 Hz, a circuit rebuilt from the cars' own GPS, and every panel showing the SPL that drew it. Built on weekends by two people who wanted to know why the McLarens were faster through Lesmo.

Free · Apache-2.0 · installs in a minute · no keys, no internet, no LLM · independent project, not affiliated with Splunk or Formula 1

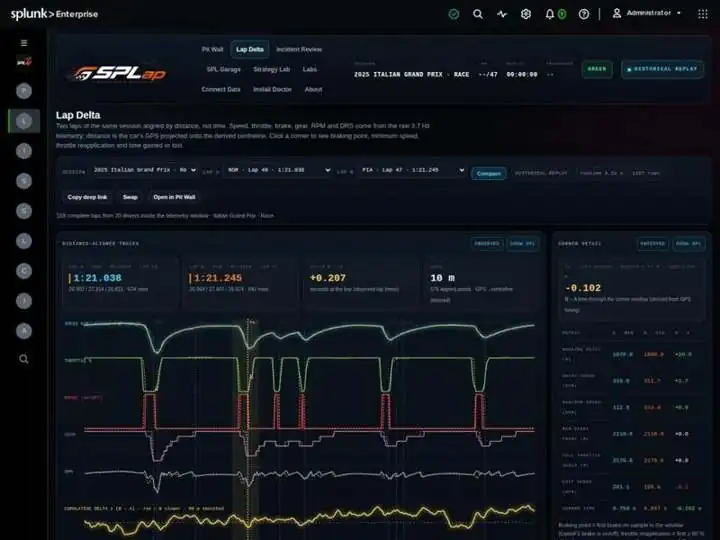
NOR lap 48 vs PIA lap 47 · aligned by distance+0.207seconds at the line · observed lap times
Telemetry rows122,300location + car data
Searches per frame0replay runs in the browser
Corners from GPS115,745 m centreline · pit lane too

Why we built it

Built on Sundays by two people who never miss a race.

Lilli wanted to see if the timing screen was lying to us.

She also wanted to learn how real software gets built — the kind with tests and a release and strangers installing it. Lloyd wanted an excuse to model race physics. Neither of us expected the circuit map to come out of the cars' own GPS, or that a Monza pit stop would show up in the data as clearly as it does on TV.

Splunk turned out to be a great place to do it. It swallows a hundred thousand telemetry events without blinking, its search language was made for exactly these time-series questions, and its dashboards let us draw a race instead of a bar chart. We aren't affiliated with Splunk in any way; we just think it's a good platform for this.

Version 2.1 is the groundwork: a clean data model, a real session, deterministic race-engineer findings you can check. The physics is next.
Lloyd Clark & LilliCo-developers · weekends, 2026

What's inside · version 2.1.1

Grounded in the data, not the vibes.

Everything on screen is either observed provider data or labelled as derived. Every chart has a Show SPL button. Nothing is generated by a language model.

13:00:00DATA2025 Italian Grand Prix, Monza, from the community OpenF1 API: laps, sectors, stints, pit stops, positions, intervals, race control, weather, overtakes, team radio, and 3.7 Hz location + car telemetry (speed, RPM, gear, throttle, brake, DRS). Bundled as lookups; import any other session yourself.
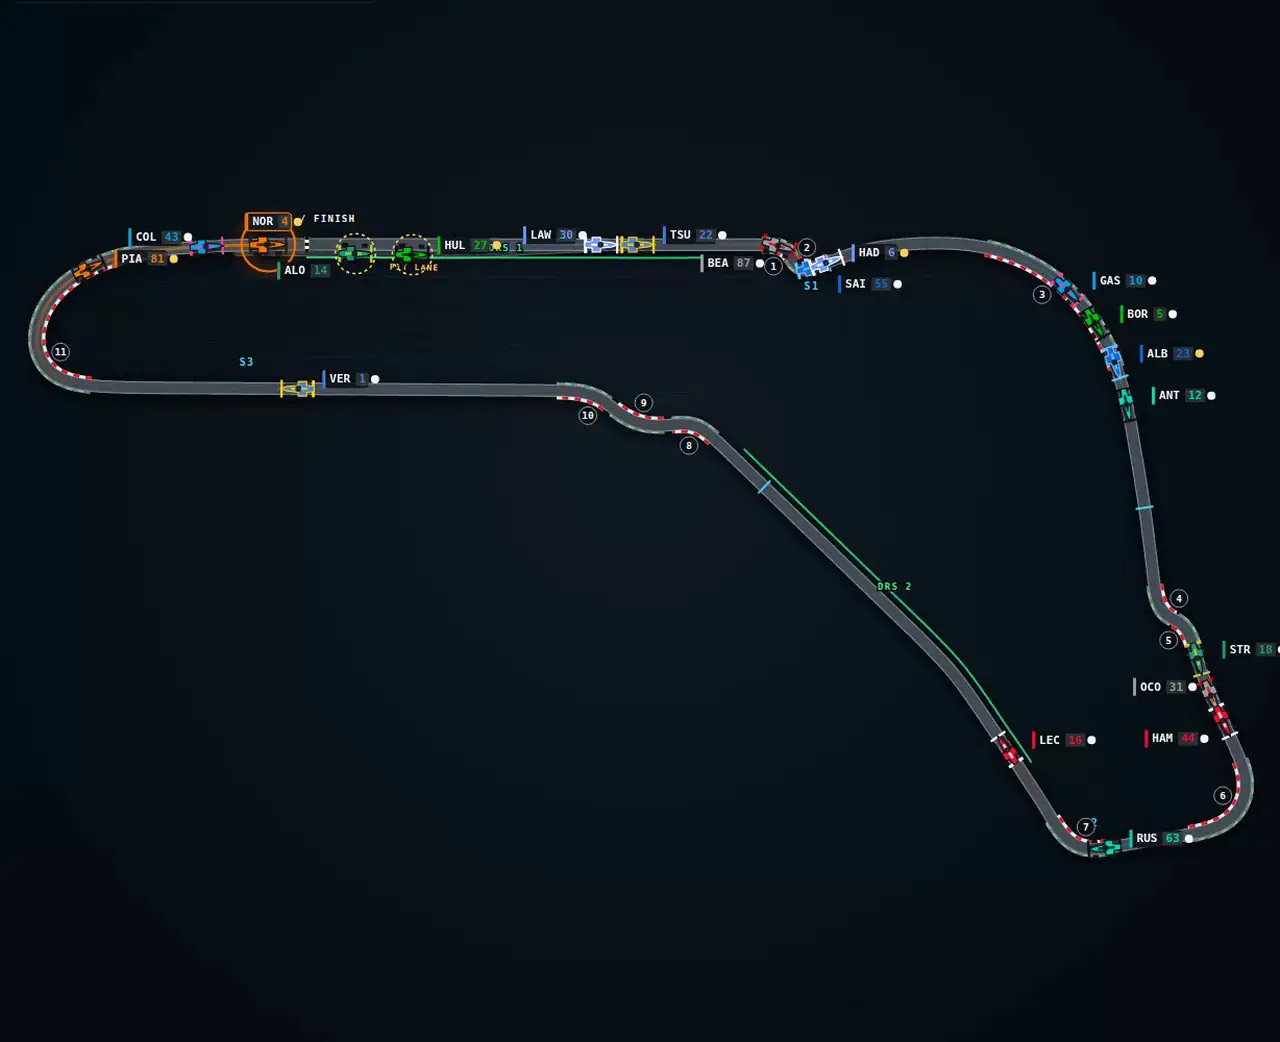
14:00:00CIRCUITGeometry derived from the cars' GPS: centreline, pit lane as its own road, sector boundaries, DRS zones, numbered corners. No official track art.
14:00:17PIT WALLHybrid SVG + Canvas renderer, livery-coloured cars with collision-aware labels, timing tower with gap and interval, driver card, 0.25×–4× replay, jump to pit / overtake / flag. Zero searches per animation frame.
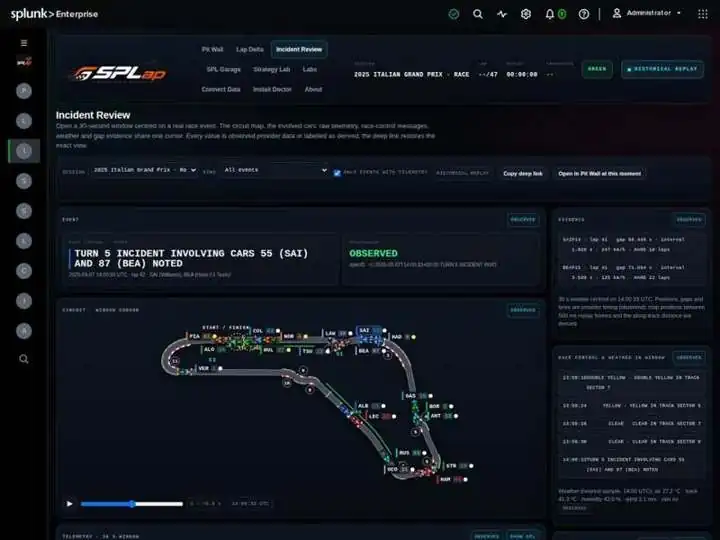
14:00:33INCIDENT"Turn 5 incident involving cars 55 (SAI) and 87 (BEA) noted." A 30-second evidence window around any race-control message, overtake or pit stop, with map, both cars' telemetry, gaps and weather on one cursor.
14:05:52LAP DELTAAny two laps aligned by distance. Click a corner for braking point, minimum speed, throttle reapplication and time gained or lost.
14:07:14ENGINEERDeterministic findings — pit-loss anomaly, undercut/overcut, tyre degradation change, battle closing rate, braking-point change — each with rule version, confidence, provenance, evidence and the SPL that reproduces it.
SCHEMAsplap.canonical/1: one index, 17 sourcetypes, provenance on every event, idempotent import id. Import wizard in the browser, offline race bundles with checksums, or a Python CLI. Credentials never touch browser code.

Engineering notes ship inside the package: DATA_SCHEMA · DATA_SOURCES · IMPORTING_A_RACE · VISUALIZATION_ARCHITECTURE — plus the full release evidence (AppInspect, clean install, browser suite).

Next release · in the garage

Next: the physics.

2.1 is the data foundation. The next version turns SPLap from a viewer into something you can argue with — every model labelled with its confidence and its SPL, same as today.

  1. Tyres

    Degradation curves

    Lap time versus tyre age per compound and stint, with fuel load and traffic corrected out. "This stint is losing 0.08 s per lap" — with error bars.

  2. Strategy

    Undercut simulator

    Drag a pit stop on the timeline and watch the projected running order, built on the pit-loss we measure and the degradation we fit.

  3. Driving

    Corner-by-corner analysis

    "VER brakes 8 m later into Turn 1 than NOR." Braking points, minimum speeds and throttle pickup projected onto the track.

  4. Energy

    Deployment inference

    Where the battery is spent on the straights, inferred from speed and throttle traces.

  5. Race story

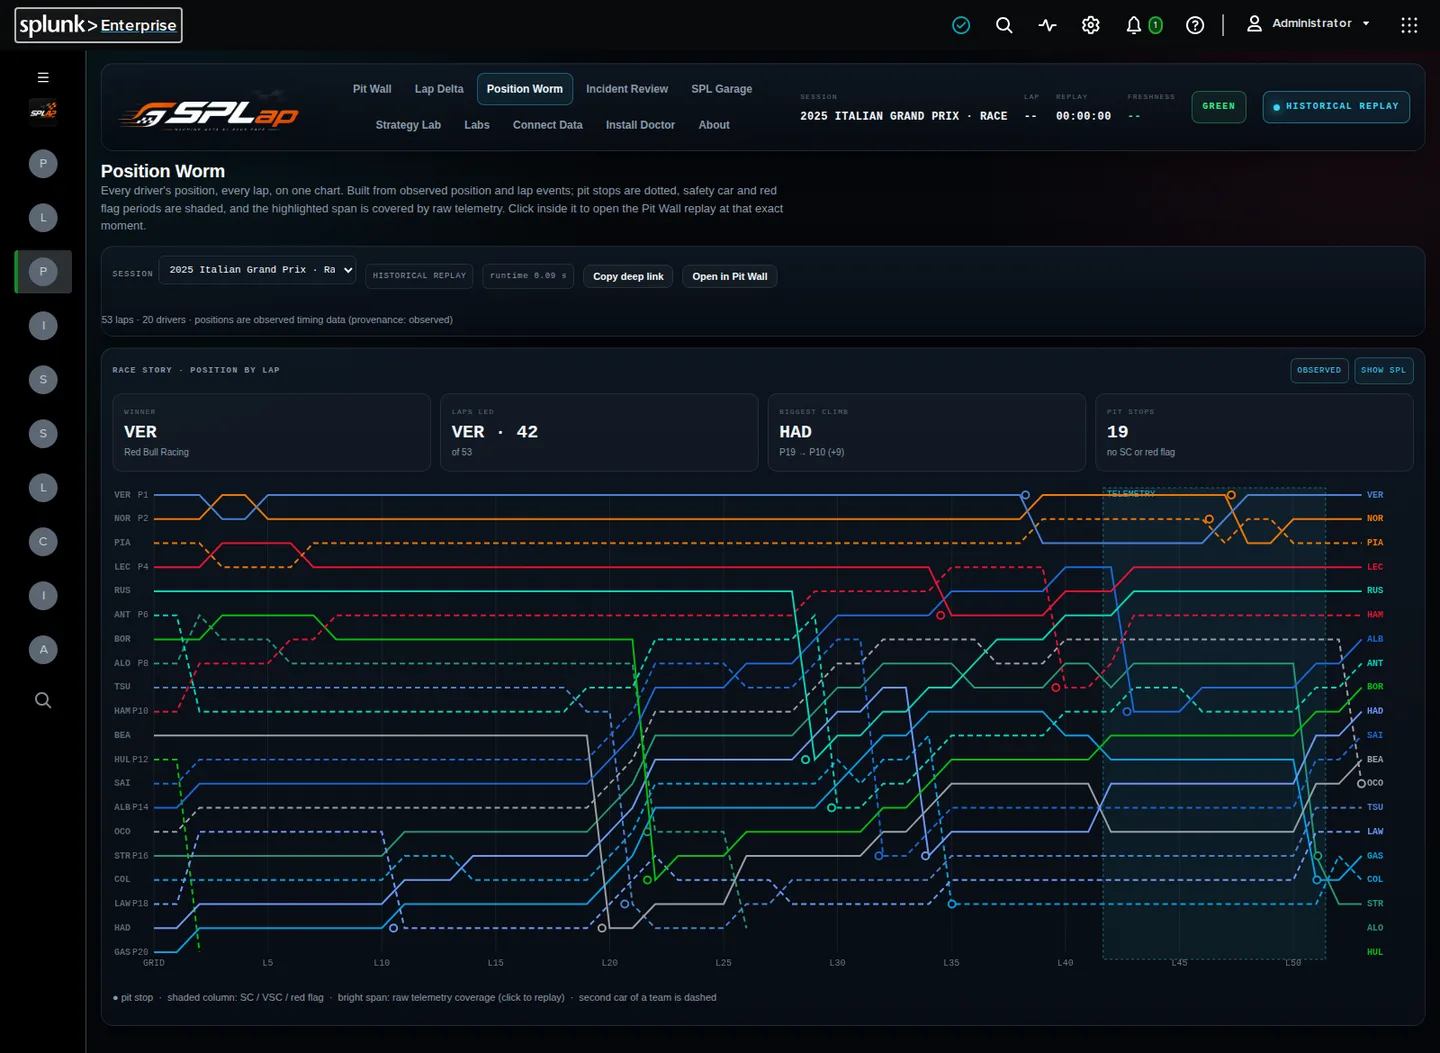
    The position worm

    Lap-by-lap positions for the whole field with overtakes and stops marked; click anywhere to seek the replay.

  6. What-if

    Re-run the race

    Change one strategy call and watch the race replay under the new plan. The big one.

Stint ordersoftmediumhard

Get it

Install in a minute.

  1. 1
    Grab the package from Splunkbase.
  2. 2
    Splunk Web → Apps → Manage Apps → Install app from file. Or splunk install app splap-2.1.1.tar.gz.
  3. 3
    Open SPLap. Monza is already moving. No setup page, no index, no internet.
  4. 4
    Want a different race? Connect Data → Import Historical Race, pick a season and a Grand Prix.

Splunk Enterprise 10.x and Splunk Cloud Platform (AppInspect-validated). No local Splunk? The free trial runs the whole app on a laptop.

Feedback

Tell us what you'd like to see.

We read everything. No list, no newsletter.
Sent. Thanks — we'll write back.